

















New in Version 4.1-alpha:
- Live sandbox plumbing for Polymarket BTC 5min markets
- Example runner showing how to use live BTC 5min hooks
- (strategy & model now included)
- open sourced some /private files (felt like it)
New in Version 4:
- Nautilus 1.226.0
- Rust-native data conversion
- Faster staged data loading
- Improved materialized caches
- Unified cache/local/archive/API message bus
New in Version 3:
- Telonex vendor support
- Local Telonex download script
- Many bug fixes & accuracy improvements
- Book replay order book deltas with trade ticks
New in Version 2:
- Nautilus via PyPI in lieu of a subtree
- Better backtest runner classes via EXPERIMENT objects
- IPython notebook support (.ipynb files)
- Joint portfolio multi replay runners
- Growing support for statistical optimizers
- New aggregate charts
- Massive improvements charting gen speed
- an attempt at a Tree-structured Parzen Estimator via Optuna
Looking for the old version? That was renamed to Version 1
Backtesting framework for prediction market strategies on Polymarket, built on top of NautilusTrader with custom exchange adapters. Limitless.exchange and Opinion.trade are planned next; Kalshi support depends on access to L2 historical book data. Current Kalshi components are research and fee-modeling plumbing, not a public runnable backtest path. Plotting inspired by minitrade. This repo is still in active development.
Fantastic single & multi-market charting. Featuring: equity (total & individual markets), profit / loss ticks, P&L periodic bars, market allocation, YES price (with green buy and red sell fills), drawdown, sharpe (with above/below shading), cash / equity, monthly returns, and cumulative brier advantage.
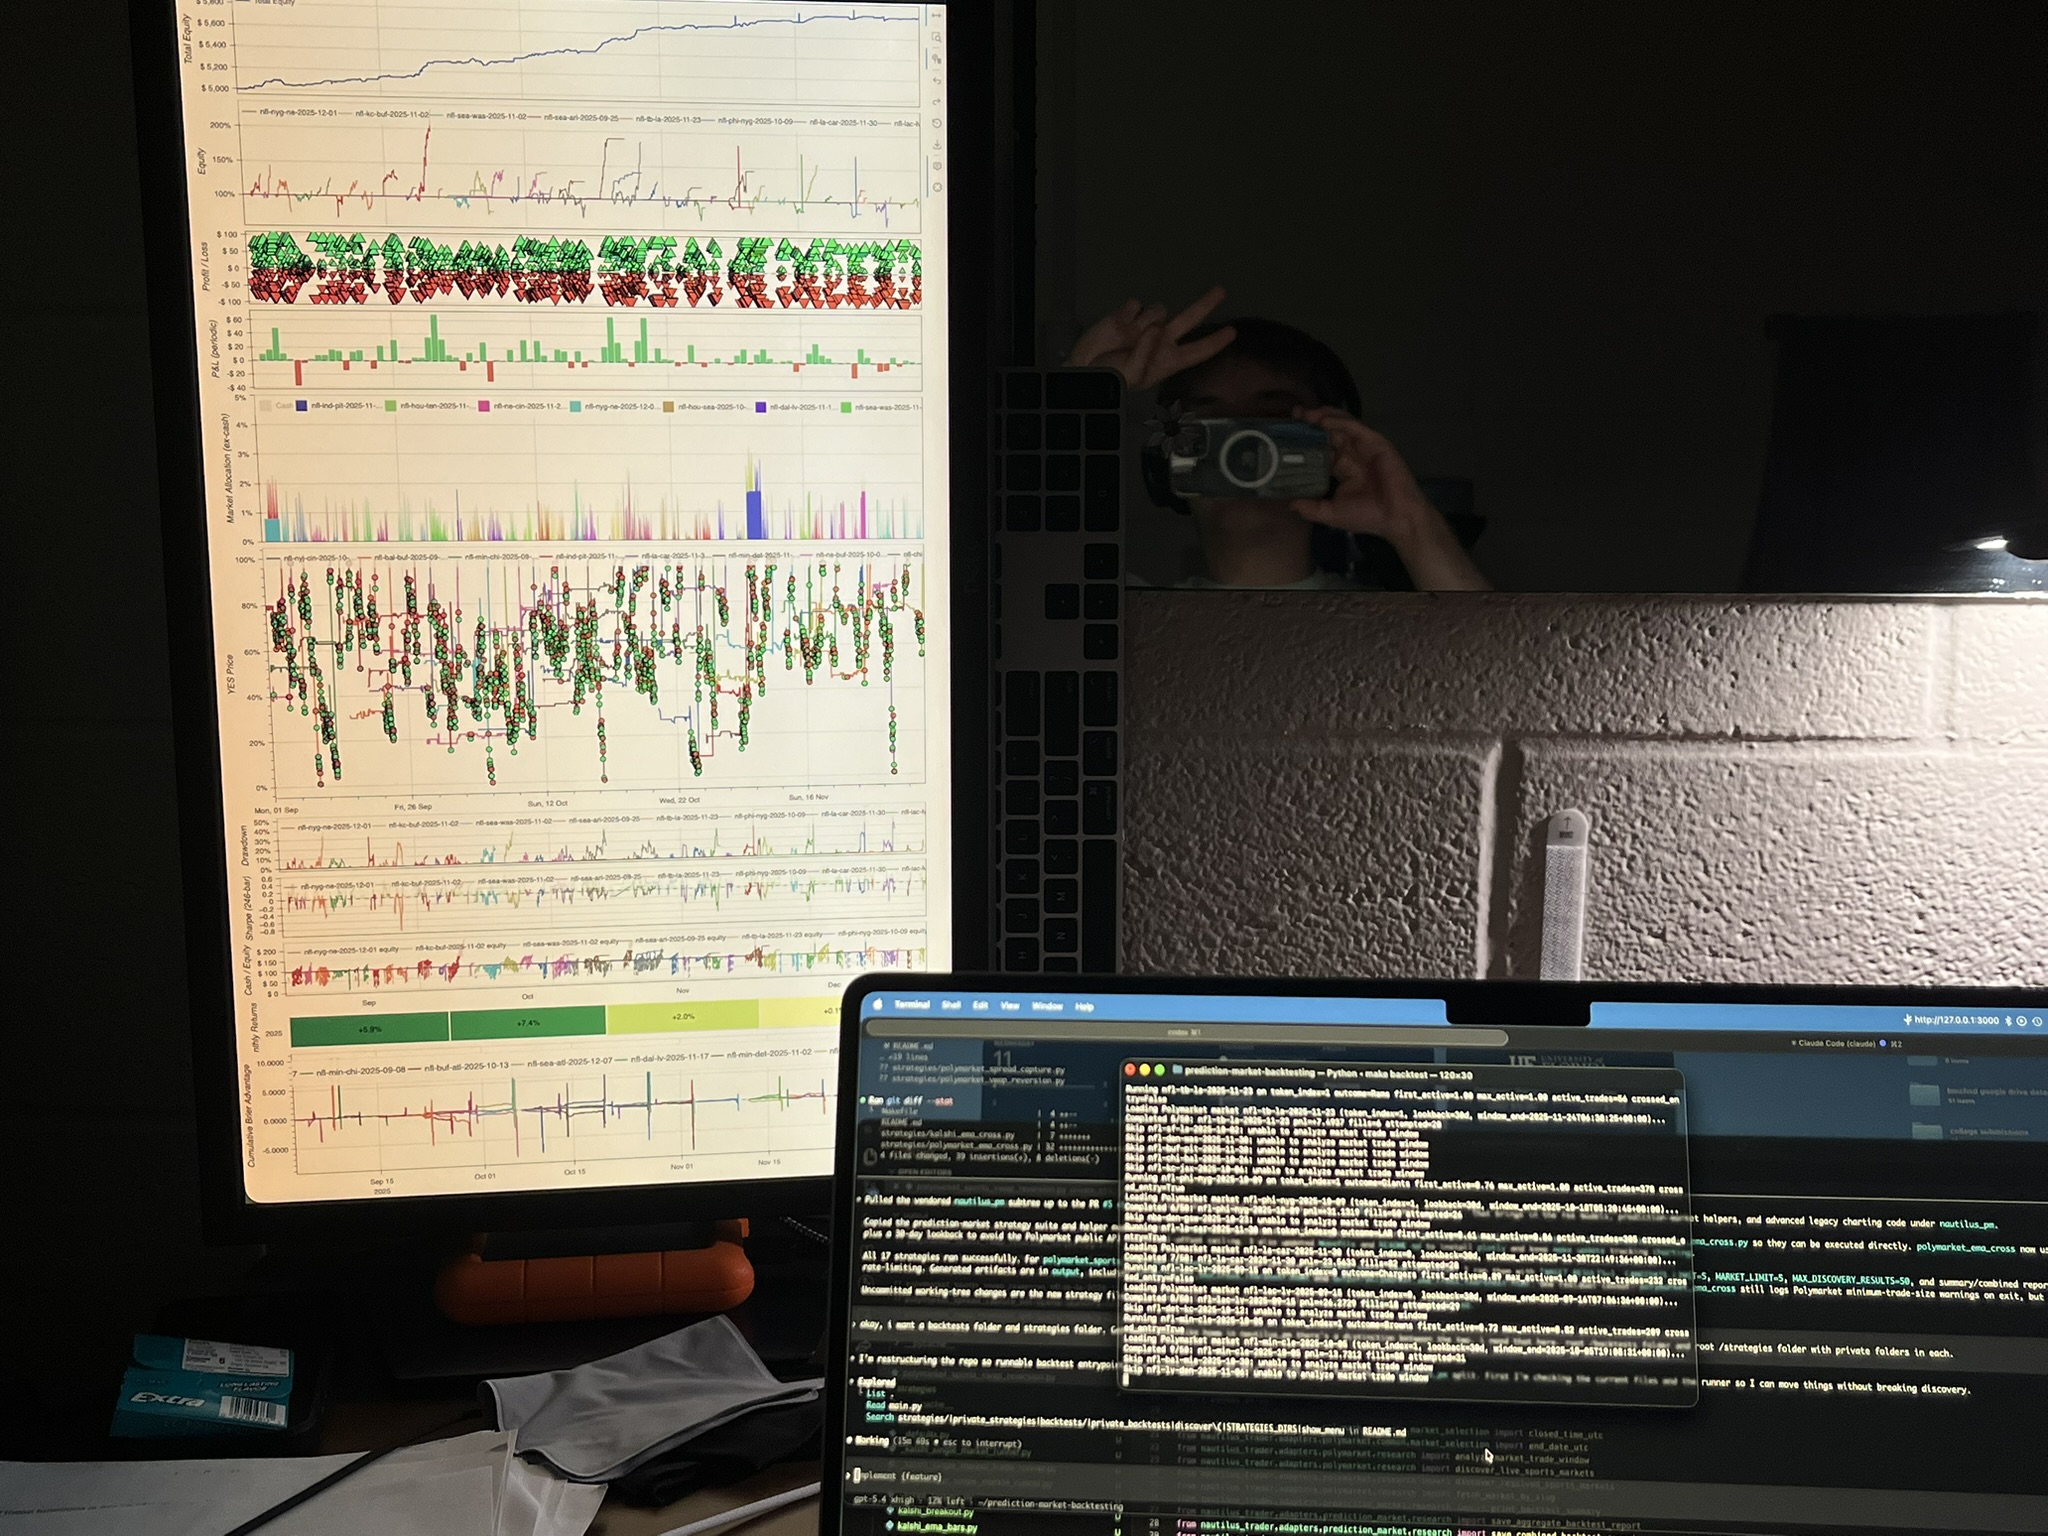
If you find any bugs, unexpected behavior, or missing simulation features, PLEASE post an issue or discussion.
Detailed guides have been filed away in the docs index for better organization and long-term sustainability.
- Docs Index
- Setup
- Backtests And Runners
- Sandbox And Live Runners
- Data Loading
- Polymarket Account Ledger Replay
- Research
- Execution Modeling
- Data Vendors And Local Mirrors
- Vendor Fetch Sources And Timing
- Plotting
- Testing
- Project Status
- License Notes