As the whole #30DayMapChallenge is much about learning and experimenting, this day is dedicated to exploring new tools! So no PyGMT for today, but we'll still be using satellite Earth Observation data, this time, to make a timelapse GIF of an iceberg calving from Antarctica!
Sentinel Hub is running a parallel challenge this November 2021, so let's take their EO Browser for a spin.

-
Go to https://apps.sentinel-hub.com/eo-browser. You'll need to login or create an account first to get the timelapse functionality to work.
-
Take your time to pan around the map and find an area you want to explore. I'll be heading to the Brunt Ice Shelf in Antarctica for this exercise.
-
On the left panel, click on the 'Discover' tab, where you can search for data sources from different satellites like the Sentinel and Landsat series.
-
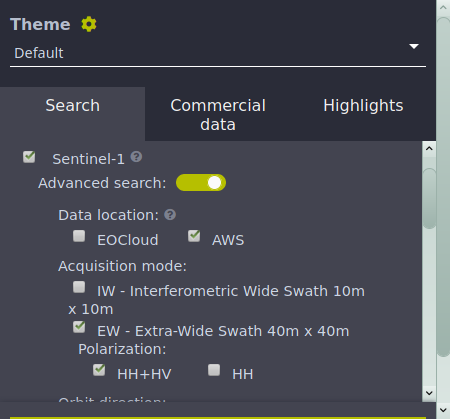
Since we don't want to mess with clouds, let's go with Sentinel 1 which is a satellite that carries a Synthetic Aperture Radar (C-band) sensor. We'll just go into the Advanced Settings and tick the box for EW - Extra-Wide Swath and HH+HV polarization. This filter will work well for our iceberg calving study area in Antarctica.
-
Next, scroll down to the very bottom. You can optionally select a time range [UTC], or just click 'Search'. I chose dates from 2021-01-01 to 2021-11-14.
-
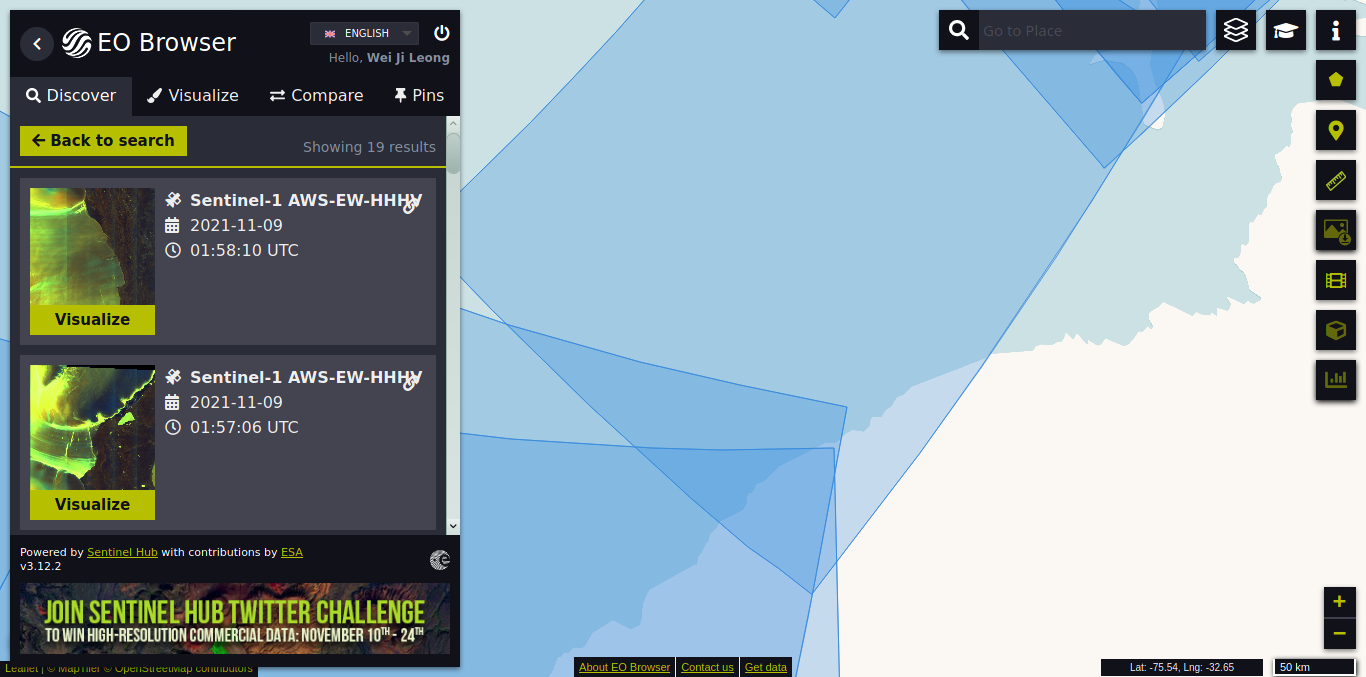
You should be taken to a view like below. On the left panel, there is a list of Sentinel-1 images taken on different dates. The map on the right will show half transparent blue 'tiles' which you can click on, and that would give you a list of images for that geographical area.
-
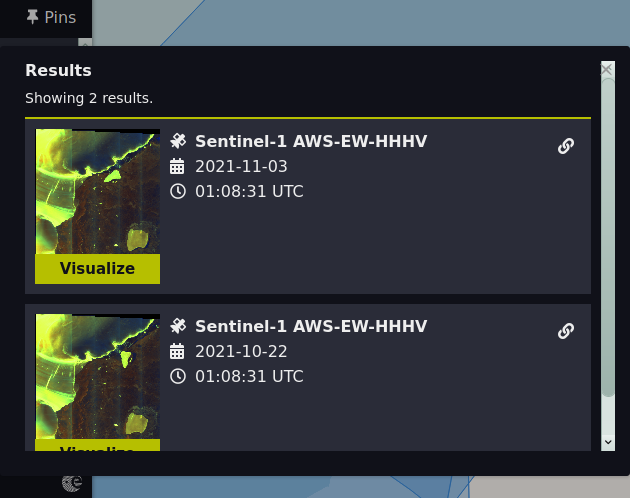
Clicking on the 'Visualize' button will take us to the next step. I'm just going to click on one of the blue tiles on the lower left (the blue tile will turn green when you hover over), and there will be a pop up with a shortlist of Sentinel-1 images. I then selected the first image on the list which was taken on 2021-11-03.
-
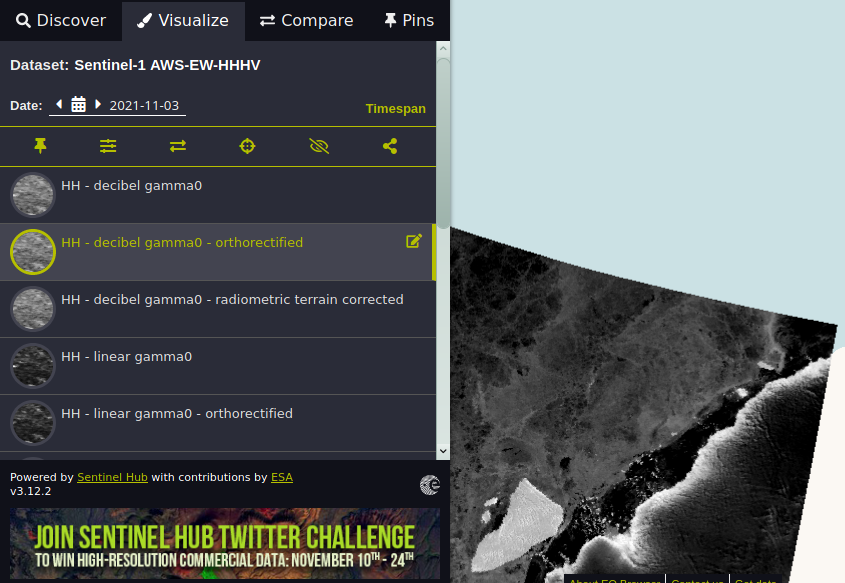
On the left panel, you should now be on the 'Visualize' tab. If you want to follow along, go to https://sentinelshare.page.link/XAFa
-
There will be a few options for Sentinel-1 polarization to choose from, have a play around to see what each of them looks like. I'll just go for the 'HH - decibel gamma0 - orthorectified' visualization option.
-
If you want to look at another Sentinel-1 image from a different location or time, click on the 'Discover' tab on the left panel, and that should take you back to the original list you searched for. Now is a good time to get an idea of how things looks like over time.
-
Once you've got a good picture of the area, and decided on the geographical extent you want to map, it's time to move to the next step.
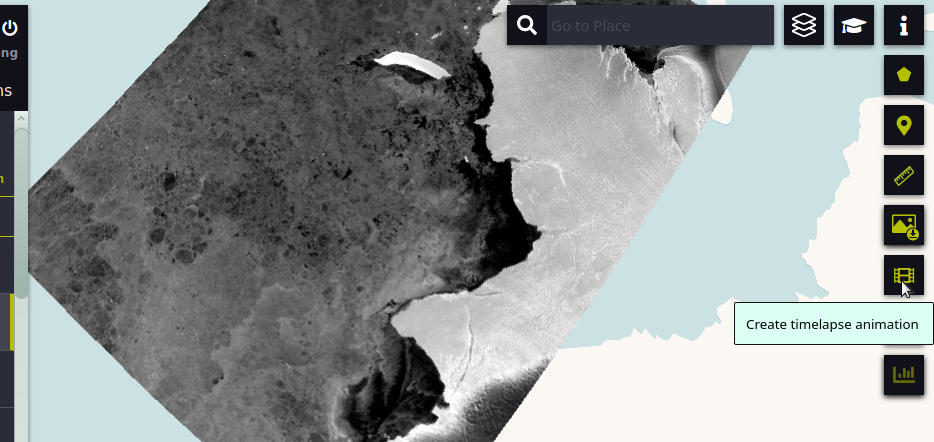
- Ensure that you have logged in, and there should be a button on the right toolbar with a film logo that is used for creating timelapse animations.
-
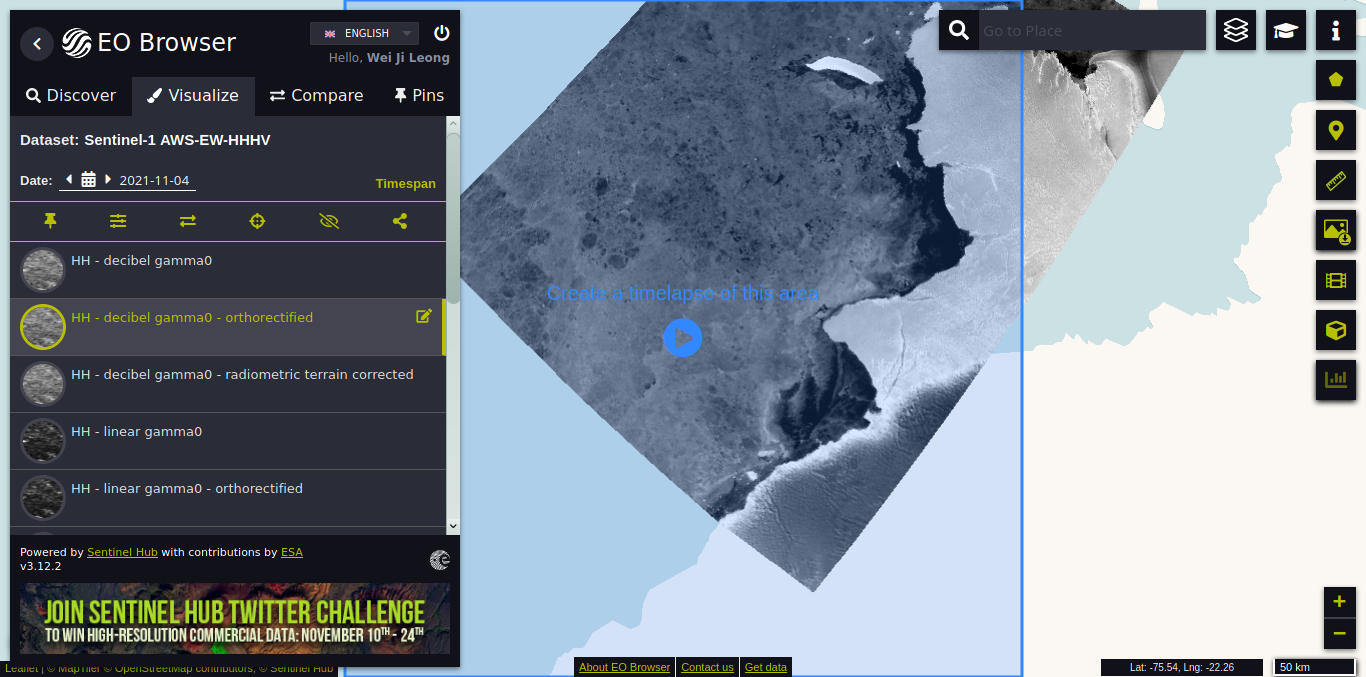
Clicking on that film button will show a half transparent blue pop-up in the middle of the map with the words 'Create a timelapse of this area' and a round blue 'Play' button in the middle. Pan and/or zoom around the map, and decide on a good region for your timelapse before clicking on the blue 'Play' button.
-
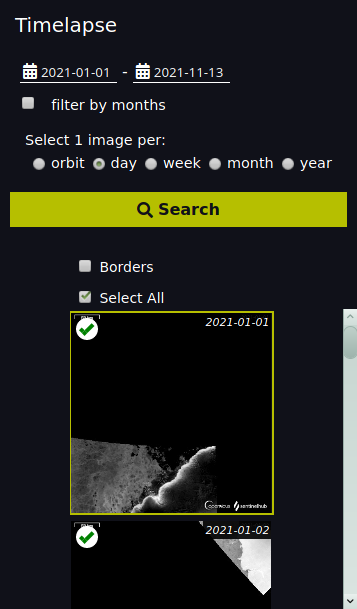
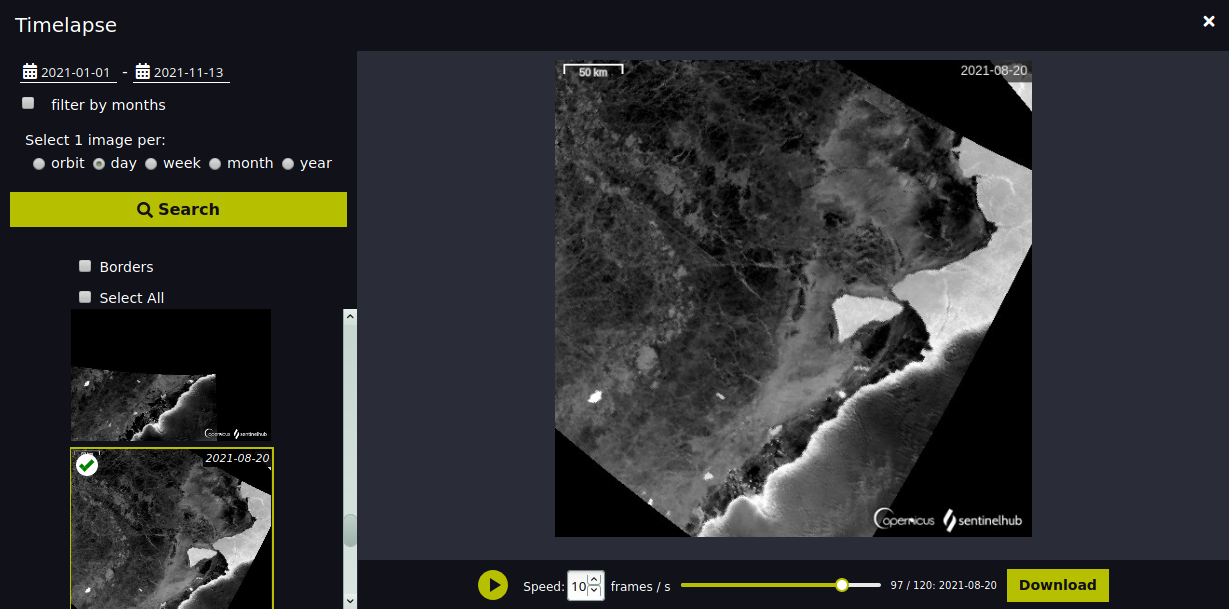
You should now see a 'Timelapse' window pop-up. There are a few options on the left to choose such as the date range, and the desired frequency of images. I picked dates from 2021-01-01 to 2021-11-14, and a '1 image per day' frequency. You want want to pick 'week' or 'month' for longer time periods. Click on the Search button when you're done.
-
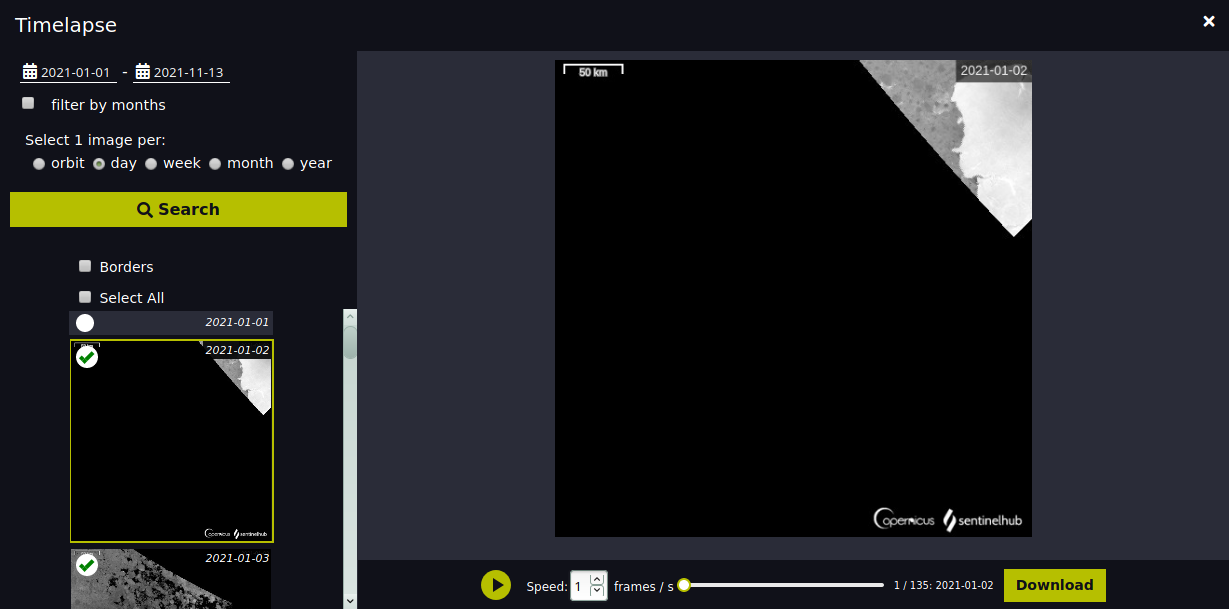
Now, there should be a list of more than a hundred Sentinel-1 images. Not all of the images are good quality, so I recommend going through the list and deselect those that are mostly dark (i.e. contain NaN values), so that the animation looks nicer later on. Below is an example of an image you probably don't want.
-
Next, you can preview the animation by clicking on the Play button and set the number of frames per second (e.g. 10).
-
Once you're happy with how the animated preview looks, click on the Download button on the bottom right, give it a few minutes, and you're all done!
Since GIFs have an upload file size limit for Twitter (15MB), it was necessary to reduce the 22MB output to something smaller. Following https://legacy.imagemagick.org/Usage/anim_opt/#compress_opt, we can use ImageMagick to do some transparency optimization:
convert S1_AWS_EW_HH-timelapse.gif -layers OptimizeTransparency +map S1_AWS_EW_HH-timelapse_opttransp.gif
This brings the size from 22MB down to 14MB, enough for Twitter.
Note that GitHub has a file size limit of 10MB, and it is possible to use
gifsicle's LZW Optimization to bring the GIF size down even more (but the
results start looking a lot worse). As an alternative, you could try:
gifsicle -i S1_AWS_EW_HH-timelapse.gif --optimize=3 --colors 32 --output S1_AWS_EW_HH-timelapse_lzwcompress.gif
This decreases the size from 22MB down to 7.9MB, but the colors won't look as nice, so I'd use it as a last resort. This suggestion was based on https://superuser.com/questions/1107200/optimize-animated-gif-size-in-command-line
Here's a list of references about Iceberg A-74:
- https://en.wikipedia.org/wiki/Iceberg_A-74
- https://phys.org/news/2021-02-brunt-ice-shelf-brink.html
- https://phys.org/news/2021-08-a-iceberg-collision-brunt-ice.html
There have been several other iceberg calving events in the past, the Larsen C was another famous one, here are the links:
- https://en.wikipedia.org/wiki/Larsen_Ice_Shelf#Larsen_C
- https://apps.sentinel-hub.com/eo-browser/?zoom=6&lat=-67.81339&lng=-65.23682&themeId=DEFAULT-THEME&visualizationUrl=https%3A%2F%2Fservices.sentinel-hub.com%2Fogc%2Fwms%2F694b409a-e12b-4922-8d51-c28dc12c8474&datasetId=S1_AWS_EW_HHHV&fromTime=2021-11-13T00%3A00%3A00.000Z&toTime=2021-11-13T23%3A59%3A59.999Z&layerId=EW-DH-HV-DECIBEL-GAMMA0-RADIOMETRIC-TERRAIN-CORRECTED