


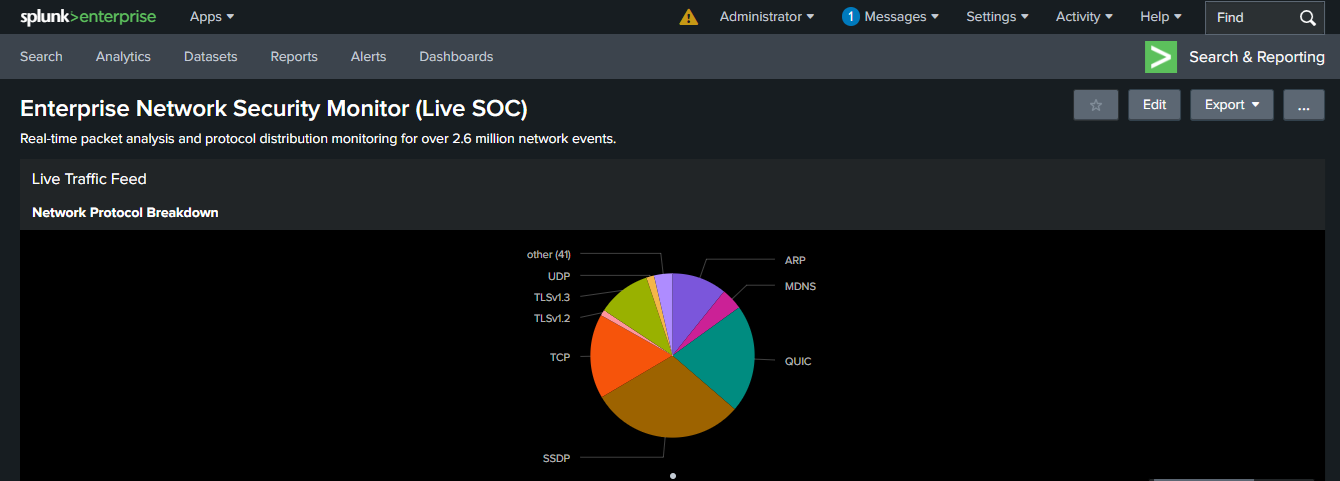
A high-performance Security Operations Center (SOC) dashboard built using Splunk Enterprise to monitor and analyze over 2.6 million network events in real-time. This project visualizes live traffic patterns, protocol distributions, and network intensity.
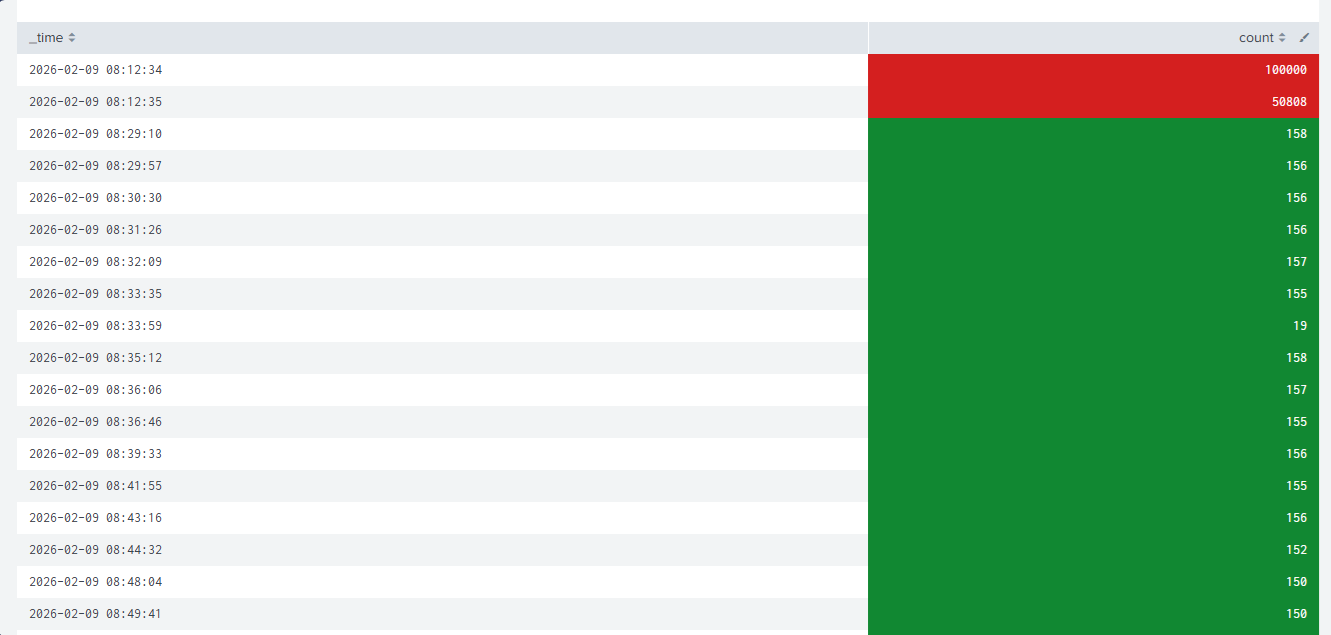
- 🚨 Live Traffic Intensity: Dynamic single-value monitor that changes color based on load (Green/Orange/Red).
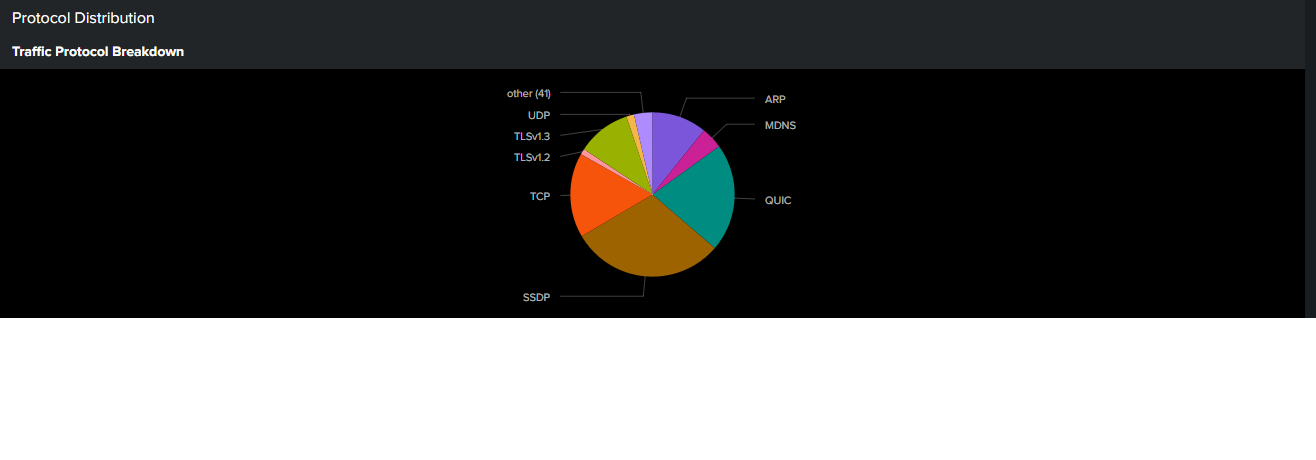
- 📊 Protocol Breakdown: Real-time analysis of SSDP, QUIC, TLS, and other network protocols.
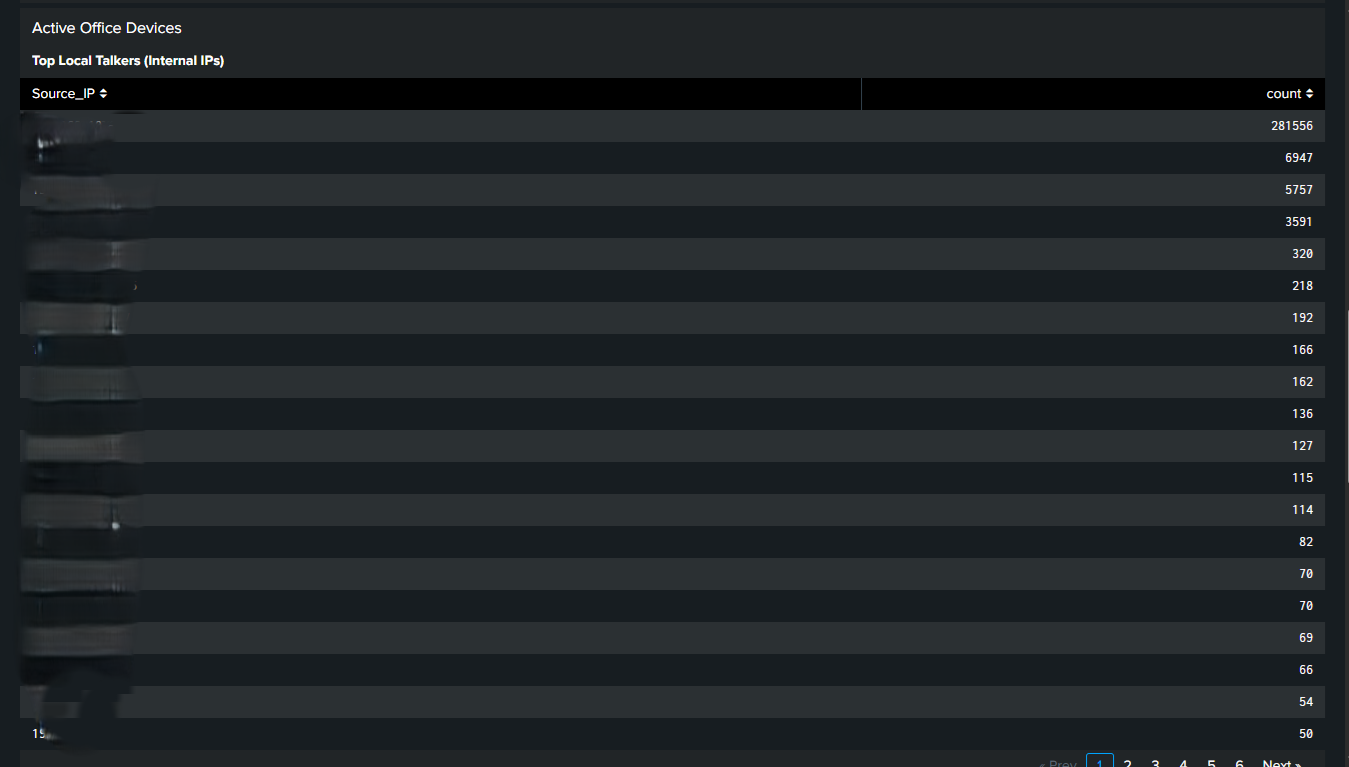
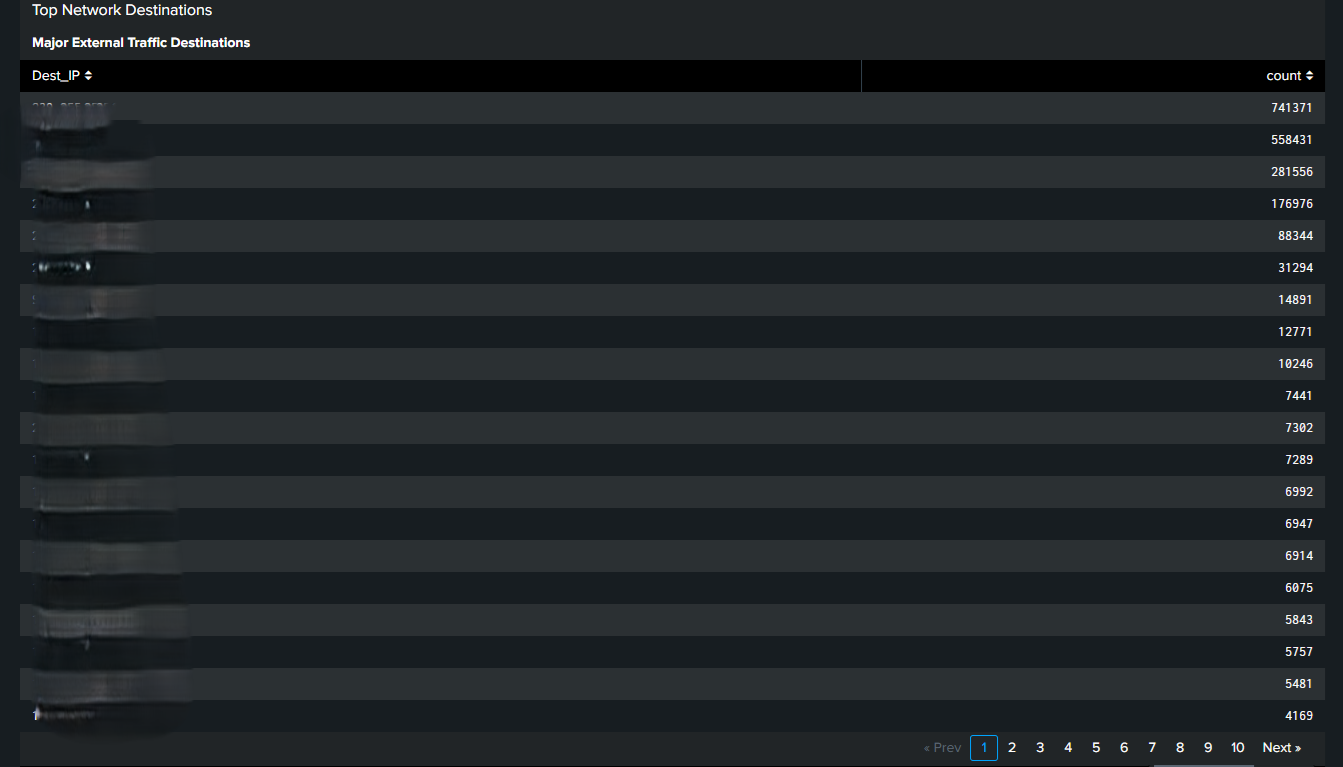
- 🔍 Endpoint Tracking: Identifying top internal talkers and external traffic destinations.
- 🌑 Dark Mode Optimized: Designed for a professional "War-Room" experience.
This is the complete view of the monitoring system, showing all critical metrics at a glance.
Our dynamic alerting system. It monitors packet flow and changes color automatically:
- Green: Normal Traffic
- Red: High Intensity / Potential Spike
Visualizing the diversity of network protocols currently active in the environment.
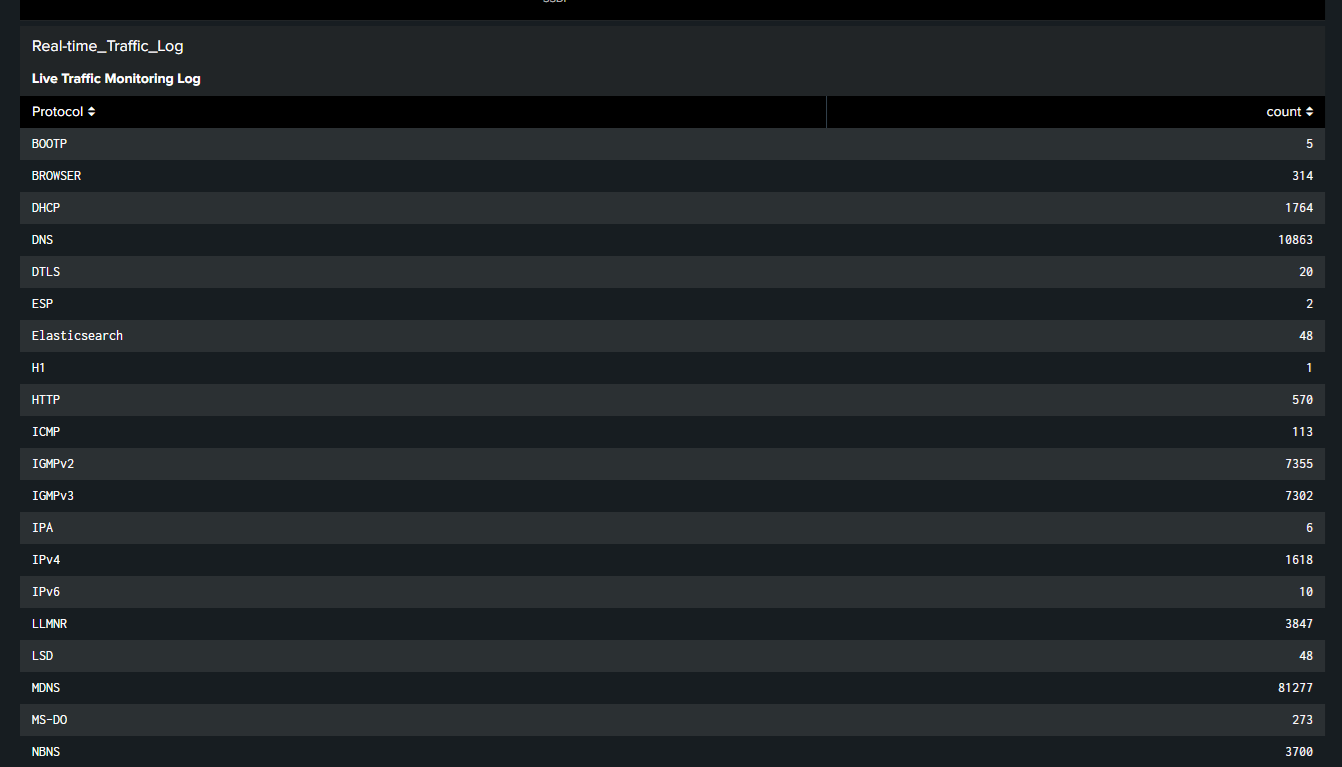
Tracking which internal devices are generating the most traffic and their destinations.
- SIEM Tool: Splunk Enterprise
- Packet Capture: TShark (Wireshark CLI)
- Data Format: CSV-based live log feed
- Language: Splunk Search Processing Language (SPL)
- Capture: TShark captures live network packets and exports them to a structured CSV.
- Ingest: Splunk monitors the CSV file in real-time.
- Visualize: SPL queries transform raw logs into the visual components shown above.
Developed by Amal Udayanga Basnayake 🚀